Now that we’ve finally passed the peak of the hurricane season and almost the entire eastern half of the country will experience nice weather for a while, it’s a good idea to take a look at the tropics to see what may be brewing there.
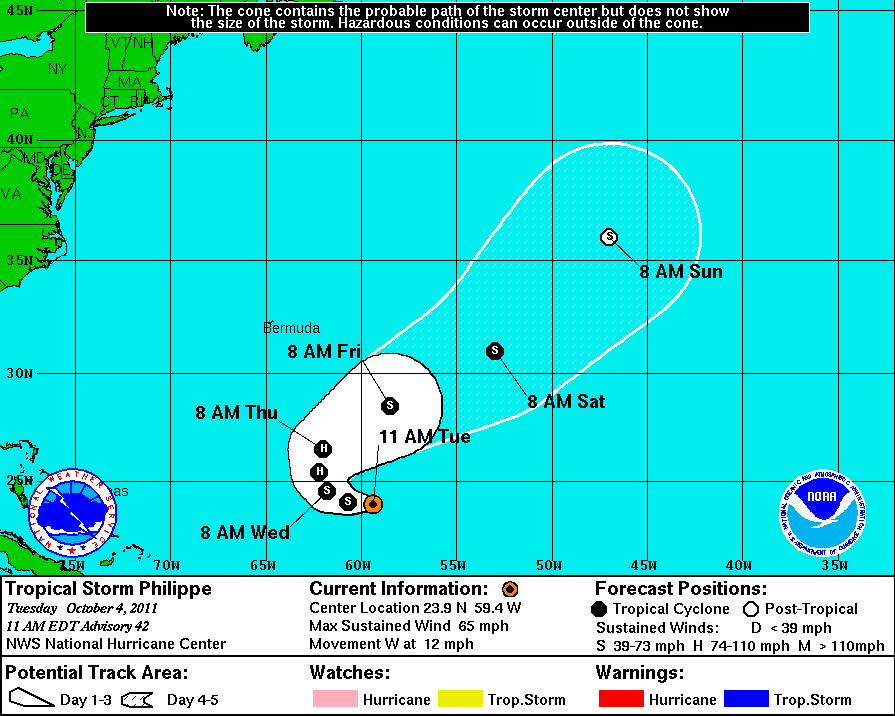
As of now, the Atlantic basin has one active tropical system, tropical storm Phillipe.
Phillipe is the only notable area of convection in the Atlantic and Caribbean at the moment. From the graphic below, a few fronts are evident, and Phillipe is marked.

Notice the large cloud shield moving toward Phillipe. This front is forecast to become quasi-stationary, but will keep Phillipe from impacting land as a tropical system.
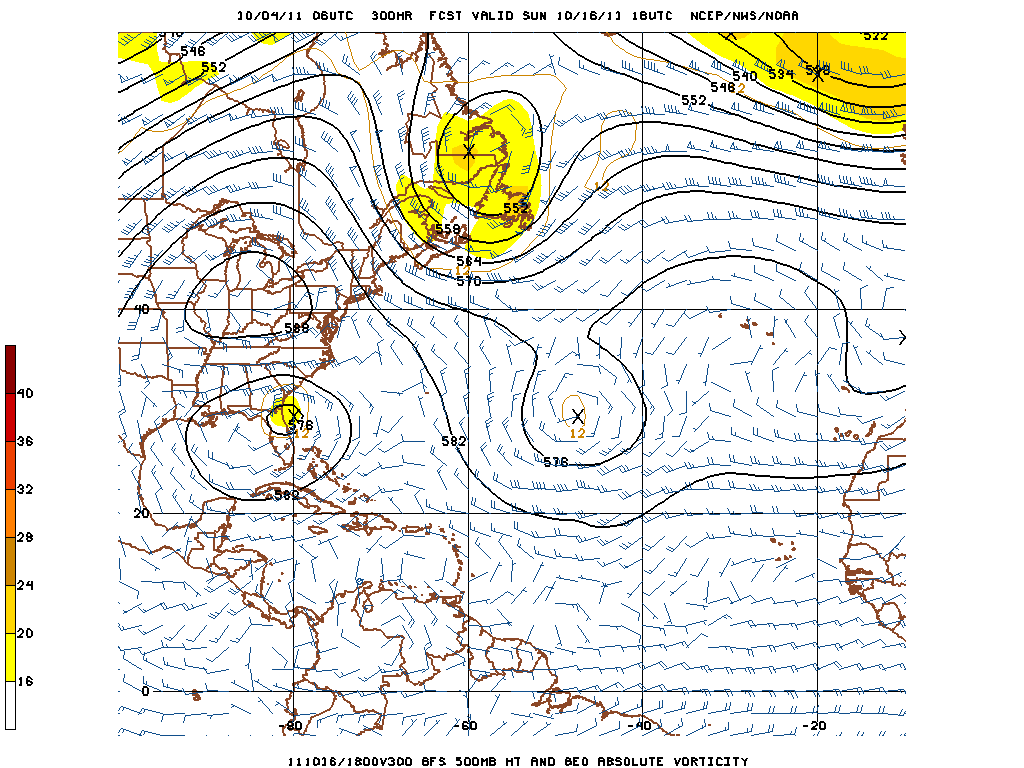
The main area that forecasters watch at this time of the year is the Caribbean Sea and the Gulf of Mexico. These areas are showing little to no activity at the moment, but model forecasts hint at a possible storm within the next 10-14 days. See the area of vorticity just east of Florida. The rotation is more pronounced at the 850 mb level.

This is forecast for 300 hours out, so this is something we'll have to wait on and see if it pans out.
With all of that said, it is still important that we’re entering back into La Niña conditions in the Pacific Ocean and that we can expect an active pattern with regards to the Madden-Julian Oscillation. Under La Niña conditions, vertical wind shear in the areas that hurricanes form within is much less than during an El Niño year. This is important in allowing the storms to grow. In addition to that, with a more active Madden-Julian Oscillation, increased latent heat flux provides necessary energy to the atmosphere for the storm to tap into.
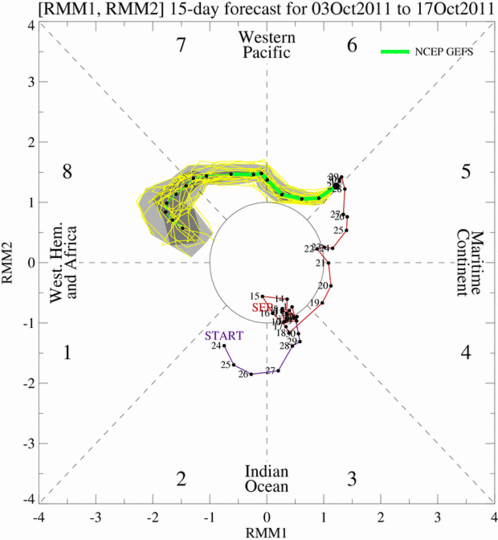
So, what is the Madden-Julian Oscillation? The Madden-Julian Oscillation is a global scale wave occurring within the tropics that promotes areas of enhanced or suppressed rainfall. It typically lasts between 30 and 60 days, begins in the Indian Ocean and propagates eastward from there. The phase of the oscillation is characterized by the spatial location of the center of enhanced convection (rainfall). When we enter the later phases of the cycle, the center of convection reaches closer and closer to the U.S. Pacific Coast. Relative humidity, westerly winds and other variables increase ahead of the center. When the conditions are in this phase, tropical cyclones are 4 times more likely to occur (Maloney and Hartmann, 2000).
Below is the GFS forecast of the MJO. Follow the green and yellow lines to see where the center would be located and read off the magnitude from the plot.
 We’ll have to wait and see how the forecast turns out, but in the short-term we could potentially see another storm form within two weeks, this one being more likely to impact the United States.
SOURCES:
— Maloney, E.D., and D.L. Hartmann, 2000: Modulation of hurricane activity in the Gulf of Mexico by the Madden-Julian Oscillation. Science,287,2002-2004.
— Wheeler, M.C. and H.H. Hendon, 2004: An all-season real-time multivariate MJO index: Development of an index for monitoring and prediction. Monthly Weather Review,132,1917-1932.

